
Understanding 1 Hectare Solar Farm Cost: A Strategic Investment Guide
As solar energy transforms global power infrastructure, the 1-hectare solar farm emerges as a sweet spot for commercial investors. This compact footprint offers scalable energy production while optimizing land use—a critical consideration in land-constrained European markets. Let's analyze the financial blueprint behind these projects and why they're reshaping Europe's renewable landscape.
Table of Contents
- The Solar Expansion: Why 1-Hectare Farms Are Gaining Momentum
- Breaking Down 1 Hectare Solar Farm Costs
- Real-World Case: Spain's 1.3MW Solar Success Story
- Key Cost Variables: Location, Technology & Regulations
- ROI Analysis: When Will Your Investment Break Even?
- Emerging Technologies Shaping Future Costs
- Is Your Land Suitable for Solar Transformation?
The Solar Expansion: Why 1-Hectare Farms Are Gaining Momentum
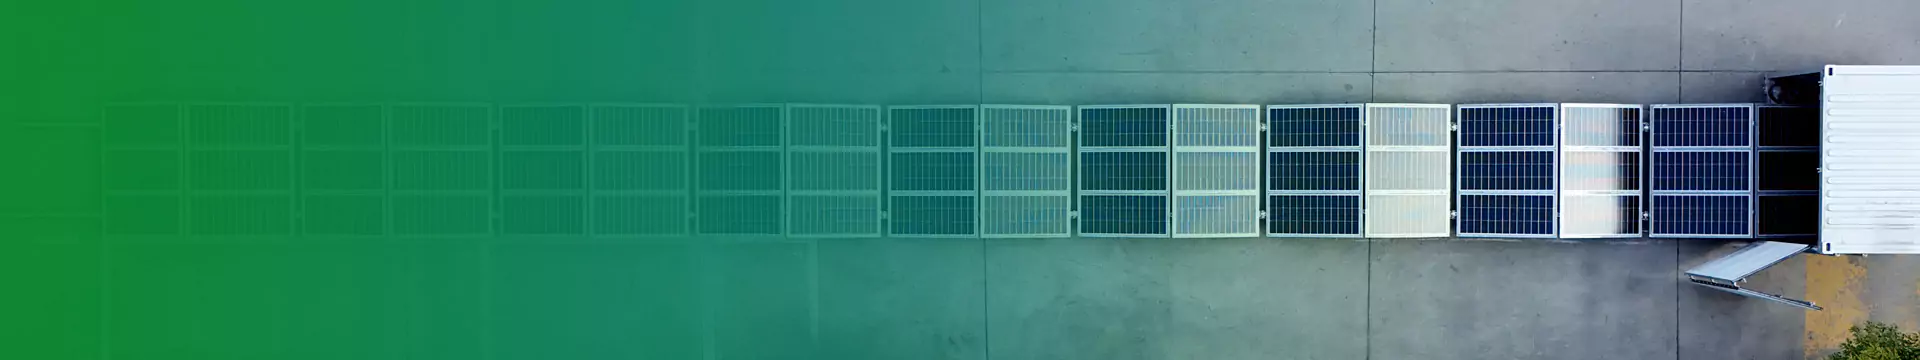
Europe witnessed a 40% year-on-year increase in mid-scale solar installations in 2023. Why the surge? A 1-hectare plot (10,000m²) typically hosts 1.2-1.5MW capacity—enough to power 300-400 homes. This scale balances three critical advantages:
- Grid compatibility: Avoids complex transmission upgrades
- Permitting efficiency: Faster approvals than utility-scale projects
- Land utilization: Ideal for repurposing marginal agricultural land

Image: Dual-use solar farm in Germany (Source: SolarPower Europe)
Breaking Down 1 Hectare Solar Farm Costs
Total investment ranges from €800,000 to €1.4 million across Europe. Here's how costs distribute:
| Component | Cost Range | % of Total |
|---|---|---|
| Solar Panels (1.4MW) | €280,000-€420,000 | 35% |
| Mounting Structures | €120,000-€180,000 | 15% |
| Inverters & Electrical | €160,000-€240,000 | 20% |
| Installation Labor | €80,000-€140,000 | 10% |
| Land Preparation | €40,000-€80,000 | 5% |
| Permits & Grid Connection | €60,000-€120,000 | 8% |
| Monitoring Systems | €40,000-€60,000 | 5% |
Notice how soft costs (permits, grid) consume 15-20%—a crucial consideration when comparing countries. Germany's streamlined permitting keeps these costs at 12%, while Italy's complex bureaucracy can push them to 22%.
Hidden Savings You Can't Ignore
Modern farms now integrate "value engineering":
- Bifacial panels boost yield by 15% with ground-reflected light
- AI-powered cleaning drones reduce maintenance costs 30%
- Pre-assembled trusses cut installation time by 40%
As SolarPower Europe's 2024 Market Outlook confirms, these innovations shave €0.02/Watt off installation costs annually.
Real-World Case: Spain's 1.3MW Solar Success Story
Consider Andalucía's La Roda Solar Farm: 1.05 hectares generating 1.85GWh annually. Their 2023 implementation proves how strategic choices impact finances:

Image: Smart monitoring at Spanish solar farm (Source: IEA-PVPS)
- Total Investment: €1.1 million (€785/kW)
- Smart Cost Controls:
- Used trackers to increase daily yield by 25%
- Negotiated grid connection during off-peak season
- Selected local contractors to avoid import duties
- ROI Achievement: 6.2 years (vs. projected 7.8 years)
Their secret? According to project lead María López: "We treated land as a living system, not just a surface. By analyzing soil reflectivity and micro-climate, we optimized panel spacing and tilt angles." This approach delivered 8% higher output than initial projections.
Key Cost Variables: Location, Technology & Regulations
Why does the same farm cost 40% more in Belgium than Portugal? Three factors dominate:
- Solar Insolation:
- Southern Spain: 1,900 kWh/m²/year → fewer panels needed
- UK Midlands: 1,050 kWh/m²/year → higher panel density required
- Regulatory Landmines:
- France's biodiversity offset requirements add €15,000-€30,000
- Netherlands' ground-mount restrictions increase structure costs
- Technology Selection:
- Monocrystalline vs. polycrystalline: 12% price difference
- Central vs. microinverters: 20% cost variation
As highlighted in the IRENA 2023 Cost Report, regional labor rates cause the widest fluctuations—German installers cost 2.3x more than Polish teams.
ROI Analysis: When Will Your Investment Break Even?
With current technologies, European 1-hectare farms typically achieve payback in 5-8 years. But look beyond simple payback periods:
| Country | Avg. Installation Cost | PPA Rate (€/kWh) | ROI Timeline |
|---|---|---|---|
| Germany | €1.25 million | 0.089 | 6.5 years |
| Italy | €950,000 | 0.078 | 5.8 years |
| Poland | €820,000 | 0.068 | 7.1 years |
Pro tip: Combine revenue streams. AgriPV projects (solar + crops) boost income by 30-40% through dual land use. The EU Energy Observatory confirms farms with grazing sheep under panels see 12% higher ROI than standard installations.
Emerging Technologies Shaping Future Costs
By 2027, three innovations will redefine cost structures:
- Perovskite Tandem Cells (35% efficiency): Reduce land needs by 20%
- Robotic Installers: Cut labor costs by 50%
- AI-Optimized Layouts: Generate 15% more power from same space
Dr. Elena Rossi (TU Delft Energy Institute) observes: "We're transitioning from 'cost per watt' to 'value per hectare.' The next frontier isn't cheaper panels—it's maximizing energy density through digital twins and predictive analytics."
Is Your Land Suitable for Solar Transformation?
Every hectare holds unique potential. What slope percentage does your terrain have? Could your soil composition support bifacial gain? Share your location specifics below—let's explore how to turn your land into a renewable powerhouse.
 Inquiry
 Online Chat